

Ground Reports – What is Your Experience With Prices of “Processed Goods” at Stores?

Recently I went to the supermarket to pick up some general provisions. Given the nature of previously predicted food price increases, and proactive measures to mitigate the predictable prices, I haven’t needed to purchase basic foodstuffs in a while. Yikes! The prices… Wow.
 Since we originally warned in ’21 about the waves of food price inflation that were coming, the prices have more than tripled on many food commodities. That part is not as surprising in current review; however, the prices of processed foodstuffs is, well, quite frankly astounding.
I am left to wonder how working-class people are able to afford the jaw dropping price increases in highly processed food products like condiments (mayo, ketchup, mustard, etc), and even coffee and milk. I knew the processing costs would drive those prices, but the scale is just astounding.
Beyond the foodstuff, what was truly stunning was the current price of non-food items at the store. Items like chemical cleaners, soaps, aluminum foil, trash bags, Styrofoam products, ziploc bags, paper goods, etc. I mean seriously, $8 for a box of trash bags, good grief.
After a review of the non-food item prices, I went back to the recent BLS report [DATA HERE] to look at the producer price index to see if the data reflected the scale of the processing cost that I was reviewing across a broad spectrum of goods.
Are consumers getting gouged by manufacturers who are taking advantage of the price shock inside the ongoing inflation?
Or are the processing costs, mostly driven by energy price increases, really that big a factor in the end product as it is generated?
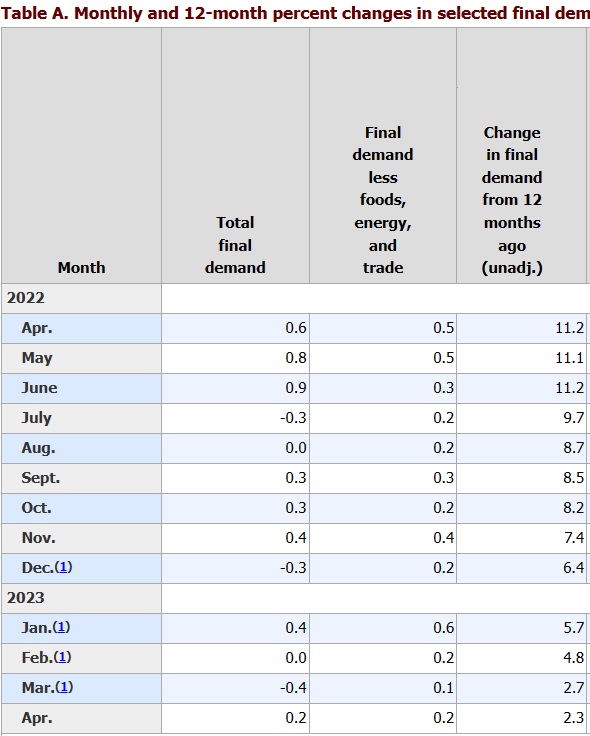
In the topline final demand Producer Price Index [Table A above] you can see how we are cycling through the second wave of inflation that hit in the spring of 2022. The rate of price increase is lower, but the prices are still rising. That means the prior massive price increase is now baked into the product, and the current price will never decline. Instead, it will just increase at a slower rate than before.
However, that’s not the full story… and that is not the data I was most curious about.
The intermediate product costs are really where the story is found.
 Table B [DATA HERE] Tells us a remarkable story.
Raw materials (unprocessed goods) are essentially in a deflationary status [-19.2% in April]. Meaning demand for the raw material has dropped well below the available supply. However, look at how much of the deflationary price is consumed in the processing of the raw materials.
A full 16% is consumed by processing cost increases [energy, physical plant, transit, production costs etc]. That is remarkable.
A random example might be citric acid. The price of the citrus base drops 19.2%, but the processing of the base into the intermediate good phase chews up 16% of the drop in raw material price and exits processing only 3.2% lower in price than a year prior.
Another example might be found in plastics. The petroleum base, and/or a combination of each material additive, might be 19.2% lower than prior year, but processing negates the lower raw material price, and exits into intermediate essentially even -.04, and then toward the ending +2.3% final demand change in the rate of price increase.
The PPI data is essentially showing the flow of costs of production as reflected in the impact during processing. We can assume mostly increases in energy, transport and distribution costs to bring the raw material forward to final good status.
Key takeaway, the demand side of the raw material is diminished. There is less raw material demand. However, processing costs are continuing to drive the final production price of goods that head into the hands of wholesalers who then bring the product to market.
The outcome of this are the prices of processed goods as noted in the products on the shelves.


Post a Comment