

U.S. GDP Grows 2.6% in Third Quarter Driven by Energy Exports and Declining Goods Imports, While Domestic Economy Shrinks
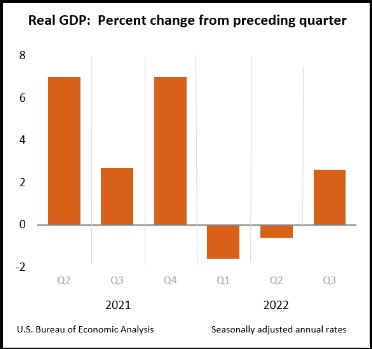 The topline of a third-quarter GDP at +2.6% looks good [DATA HERE]. However, a look into the numbers shows alarm. The domestic U.S. economy, as measured by Main Street creating goods and services for domestic consumption, contracted in the third quarter.
The Gross Domestic Product (GDP) calculation is a valuation of all goods and services created within the economy, minus the value of goods and services imported. However, even a cursory look under the topline number shows how the import/export dynamic creates the illusion of economic growth.
In the third quarter we exported hundreds of billions worth of energy products, including massive liquified natural gas (LNG) sales to Europe, and oil sales to the global market from the strategic petroleum reserve. We also sold billions in weapons to Europe. Those sales are calculated as exports, lifting the GDP number (Table 1). At the same time, imports of durable goods into the United States collapsed; meaning less was deducted from the GDP. The net import/export impact on the GDP dynamic was +2.77% (Table 2).
Meaning the third-quarter import/export dynamic alone contributed 2.7% growth to the percentage of change for the prior period. However, the total GDP only rose 2.6%, because the actual economic value created domestically got smaller. We made less internally, sold less internally and consumers purchased less internally.
You can see the import/export dynamic in whole dollars within Table 1:
TABLE 1 – We exported 17.2% more goods in the third quarter than in the second quarter (that’s mostly energy sales and food sales to the global market). We imported 8.7% less goods in the third quarter than the second quarter. That’s mostly the drop in companies ordering products from overseas for sales in the United States. Companies imported less because inventories climbed as consumers stopped purchasing durable goods and non-essentials.
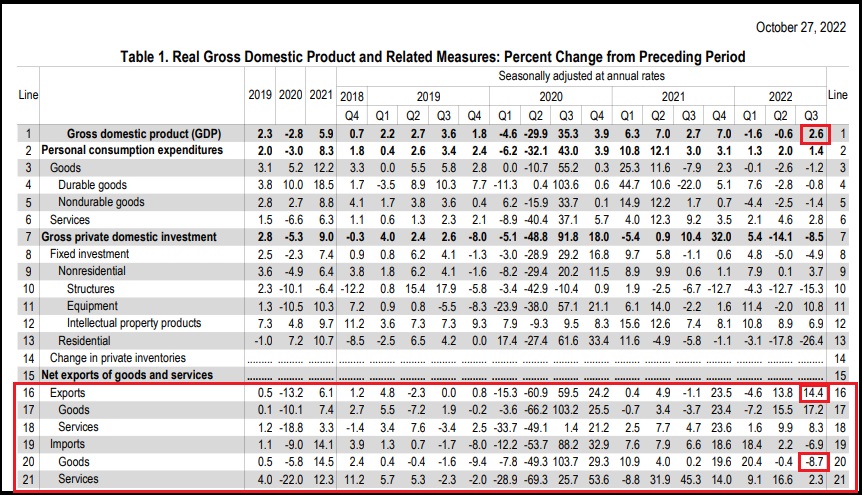
Table – 2 (modified for clarity) shows us the impact or contribution from the import/export dynamic:
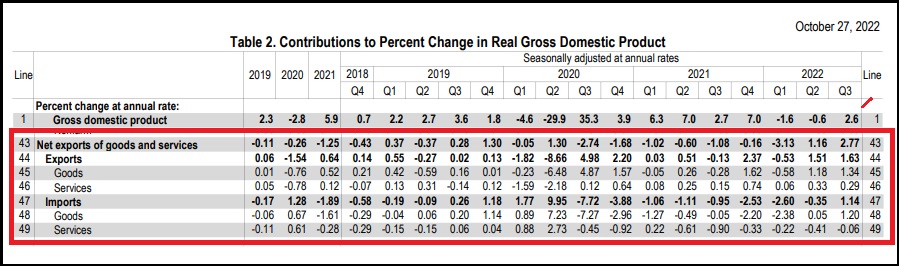
In Table-2 you can see the net impact of higher exports and lower imports lifted the GDP by 2.77%. However, the total GDP only gained 2.6% due to the other dynamics inside the economy slowing down. The import/export dynamic alone was enough to explain the entire gain in Q3 GDP and is a function of US support of the European war economy as the US exports record number of commodities (oil and gas), as well as Joe Biden’s massive multi-billion weapon sales to Europe.
The Biden administration will use the +2.6% GDP number to claim the U.S. “recession” never existed, despite two previously negative quarters. However, while technically the talking point may be true, the domestic U.S. economy (Main Street) is making less stuff and consumers are buying less stuff.
The savings rate is also declining. BLS: “Personal saving was $626.1 billion in the third quarter, compared with $629.0 billion in the second quarter. The personal saving rate—personal saving as a percentage of disposable personal income—was 3.3 percent in the third quarter, compared with 3.4 percent in the second quarter.” American households are saving less because essential purchases like housing, rent, food, fuel and energy, are costing much more.
When households evaluate their checkbooks, a Biden administration claim of a growing economy falls flat – because the only part of the economy that is growing is the part that fuels the energy needs of Europe. Main Street USA is suffering through the massive inflation that Joe Biden has created, and purchases of anything other than necessities have come to a near halt.


Post a Comment